Welcome to EggCalc™, an exposure calculator that makes it possible to compare lighting results using Lighttools Original, Lighttools CUfocus, and a diffused light without soft egg crates
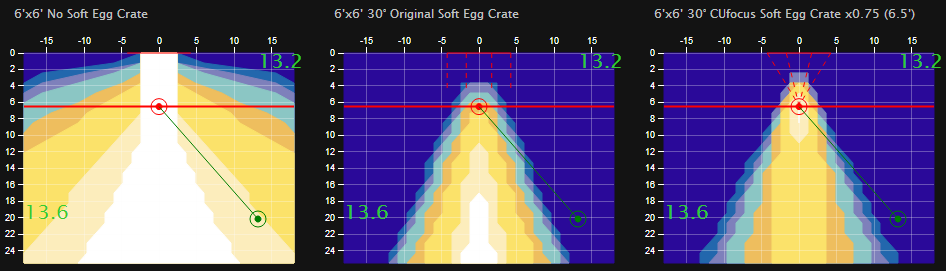
EggCalc shows exposure variations from center axis (red dot) to any selected point off center axis (green dot). EggCalc provides this information for Lighttools models at selected distances and most diffused light source sizes.
We have worked diligently to make EggCalc easy to use and understand. EggCalc data has been verified by controlled light measurements and theoretical analysis using an evenly diffused light and various models of egg crates. We will continue to improve the functionality of EggCalc software as we receive feedback and suggestions. Send Feedback
Definitions:
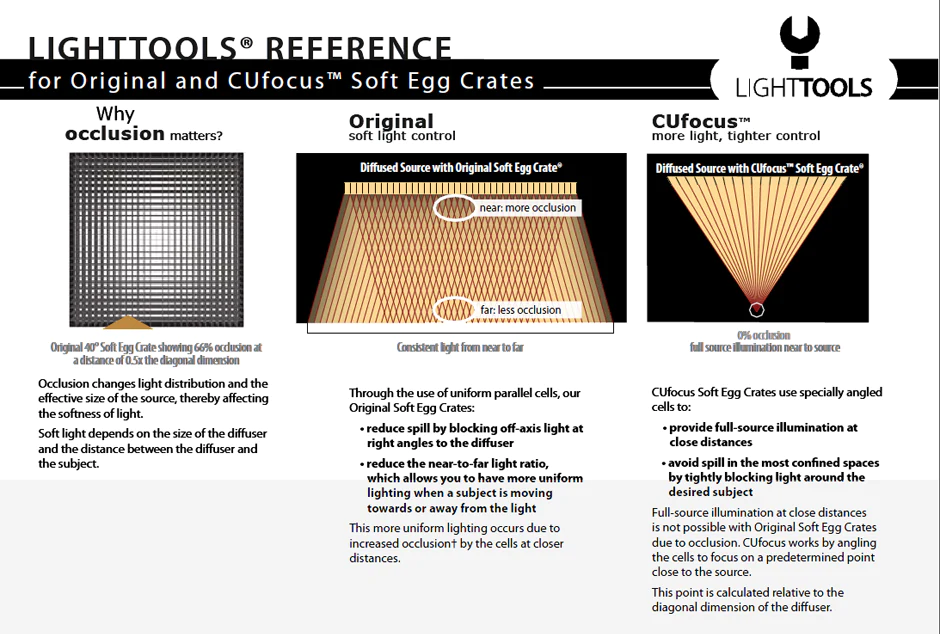
Original Soft Egg Crates Uniform parallel cells block off-axis light and reduce near-to-far light ratios.
CUfocus Soft Egg Crates Specially angled cells set to a predetermined distance point provide full-source illumination at close distances and dramatically block off-axis light.
Occlusion Occlusion is the blocking of light from the source to the subject due to the angle of Soft Egg Crate cells; this occlusion increases at close distances.
Off-axis Moving off the center axis line-to the left or right, higher or lower-is referred to as being off-axis.
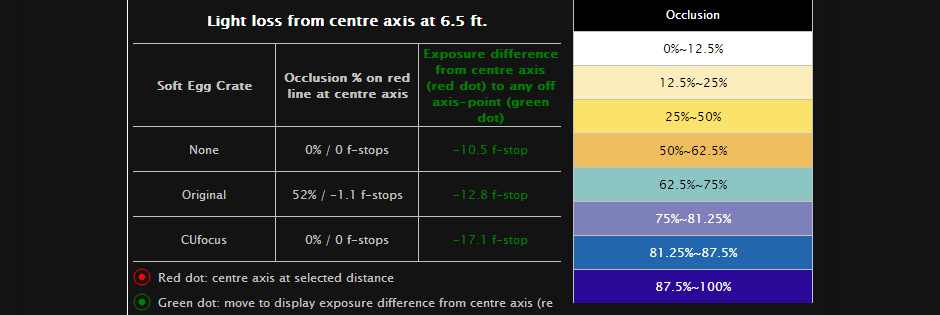
The meaning of the values generated in the Light Loss Charts
Occlusion % on centre axis:
EggCalc calculates the amount of occlusion on the center axis. This number can be seen in the second column of the Light Loss Chart for Original and CUfocus Soft Egg Crates. The occlusion equates to the light loss that takes place when the egg crate is used.
Exposure difference from centre axis to any off-axis point:
This information is displayed instantly in the third column of the Light Loss Chart by moving the cursor (green dot) to any selected point on the graph (red dot). The exposure difference takes into account both occlusion and attenuation (the natural decrease of light when measured off center axis).
The percentage of occlusion shown in the graph represents the amount of light blocked by the cells. This percentage also represents the size reduction of the effective light source.
The green horizontal numbers show the offset distance from the centre axis and the vertical numbers show the distance from the red line.
lighttools.com